Contents
Introduction
How it works
Getting started
Dashboard
My tests
Mock test session
Review mock test
Ask AI
Performance analysis
My favs
My purchases
How to use coupons?
Support
Performance analysis allows Questionbang app users to compare score and speed of different mock test sessions. The feature is available only for mock sets offering more than one model papers.
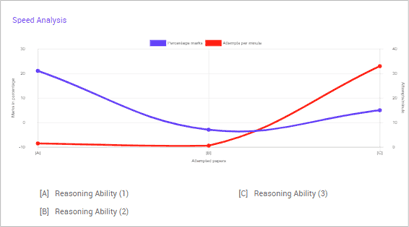
Score & Speed Analysis
The chart here is for a mock set having 3 mock tests (or model papers) - Reasoning Ability (1), Reasoning Ability (2) and Reasoning Ability (3). The chart is showing both scores and speed:
Y axis (left) - scores as percentage,
Y axis (right) - speed as number of questions attempted per minute,
X axis - model papers (mock test sessions),
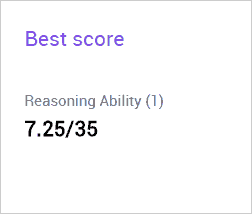
Best Score
This is your highest score from completed mock test sessions.
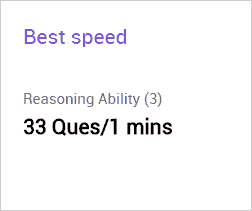
Best Speed
This is your highest speed (number of questions attempted per minute) from completed mock test sessions.
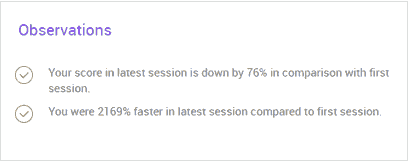
Observations
This is a summary of your performance - scores and speed from first and latest sessions are compared.